Showing posts with label Technical Analysis. Show all posts

Wednesday, June 22

Technical Analysis (TA) can make investors rich


Introduction:

Don’t depend only on rumors, learn first. You may lose capital if you run with rumors. Share business is not for uneducated persons. It’s one kind of business. So, you have to learn many things before investing. There are many terms, like NAV, P/E, EPS etc. You have to know Fundamental Analysis (FA) and Technical Analysis (TA) both as a successful investor.

What is Technical Analysis?

Now I am telling what Technical Analysis (TA) is. TA is a method to analyze stock and make investment decisions accurately based on its past history. TA works mainly on Price and Volume. Actually TA works 80% on price and 20% on volume. TA does not result in absolute predictions about the future. Instead, Chart analysis can help investors anticipate what is "probable" to happen to prices over time.


In the above chart, Bollinger band (red line) is showing price volatility of stocks. Green line represents 10 days moving average. In the lower portion of this chart is volume bar. Red bar indicates bearish (downtrend) and Green bar indicates bullish (uptrend). 
There are few basic TA indicators, such as RSI (Relative Strength Index), MACD (Moving Average Convergence-Divergence), MFI (Money Flow Index), Stochastic, William %R, ADX (Average Directional Index) etc. Moving Average is very useful in Technical Analysis. You can use some popular moving average for trading, like 3, 9, 13; 10, 20, 50, 200 days Moving Average (MA). TA can give you an idea about overbought (Technical person will sell) or oversold (Technical person will buy) situation of your stocks also. TA can define Support-Resistance level of any stocks which represent key junctures where the forces of supply and demand meet. Stock price is related to supply and demand also. TA uses a wide variety of charts that show price over time. You also have to understand some popular and widely used chart patterns.

Few good indicators

Trading with Charts:

AmiBroker is one of the best Technical Analysis software. You can import market data into AmiBroker as CSV/excel format for analysis. There are many AFLs available which can provide buy/sell signal and can be used in AmiBroker. TA may give many fake signals, you have to understand which one is fake or real signal by using different indicators. 

Conclusions:

In summary, TA can help you to understand the market trend (bull or bullish); it can also help to get buy/sell decision, i.e. right decision in right time. So, learn Fundamental & Technical Analysis for Minimize Loss & Maximize Profit.

                        http://www.investorsbd.com

Sunday, June 12

Bollinger Bands


Introduction:

Bollinger Bands are a Technical Trading tool created by John Bollinger in the early 1980s. Bollinger bands are probably one of the most important indicators ever developed for measuring price action volatility. You can use to achieve near perfect entry and exit consistently. There are a few variations on how to use Bollinger bands depending on market conditions.

You can use Bollinger bands as a very accurate indicator within any time frame.

Bollinger Bands Basic:

Bollinger Bands are a way to display volatility and relative overbought and oversold price levels over a specific period. The three parts are commonly labeled as a Center line, Upper band and Lower band. The center line is usually a simple moving average, while the upper and lower bands are simply the centerline with a standard deviation added or subtracted.


The standard settings for the Bollinger Band are a 20-day simple moving average for the center, with a 2 standard deviation set for the outer bands. There is no best setting, but when developed the (20, 2) setting were used by John Bollinger, and will work for most stock charts.

How to trade with Bollinger band

The candlesticks present represent current approaching price action to the upper band or lower band. Lets start with number 1 to number 8, one by one.

1. Extremely bearish, price is falling to a lower band and the KEY is of course watching both the upper and lower band as price approaches. In this case the upper is rising while the lower is falling indicating not only a potential explosion in price but one to the downside is extremely likely.
2. Extremely bullish, price is rising to the upper band and the KEY is keeping a watchful eye on BOTH band as price approaches. In this case the upper band heads UP and the lower band falls, indicating a potential price explosion to the upside.
3. Price approaches the lower band while the upper and lower band remain flat. This is very insignificant and should be ignored unless things change.
4. Price approaches the upper band while the upper and lower bands remain flat. This is also insignificant and best left for the amateurs to enter.
5. Bearish candlestick at a lower band while band constrict - this is a sign that price is likely at least for now going nowhere. Wait do not enter.
6. Same here, a bullish candlestick at the upper band while the bands are constricting is a sign that not much is about to happen just yet.
7. Like number 1 this is a sign that price is going to make a nice move but the lack of the upper band hooking up indicates that the move for now won't necessarily be explosive.
8. Also similar to its counterpart in that price will likely move but not to the explosive level that would be expedited if the lower band was hooking downward.  The lack of the lower band hooking down limits the potential move here.

Conclusions

Bollinger Bands reflect direction with the 20-period SMA and volatility with the upper/lower bands. As such, they can be used to determine if prices are relatively high or low. According to Bollinger, the bands should contain 85-90% of price action, which makes a move outside the bands significant. Technically, prices are relatively high when above the upper band and relatively low when below the lower band. However, relatively high should not be regarded as bearish or as a sell signal. Likewise, relatively low should not be considered bullish or as a buy signal. Prices are high or low for a reason. As with other indicators, Bollinger Bands are not meant to be used as a stand alone tool. Chartists should combine Bollinger Bands with basic trend analysis and other indicators for confirmation. So, Bollinger bands is a very accurate indicator within any time frame.

Tuesday, June 7

Make profit by using Moving Averages

A moving average line is just the average price of a stock over the period of time. The Two Moving Averages Use two moving averages: the 10-SMA and the 30-EMA. I like to use a slower one and a faster one. Do you know Why? Because when the faster one (10) crosses over the slower one (30), it will often signal a trend change. Let's look at an example: Delta Spinning chart of moving averages:

Chart of Delta Spinning


You can see in the chart above how these lines can help you define trends. On the left side of the chart the 10 SMA is above the 30 EMA and the trend is up. The 10 SMA crosses down below the 30 EMA in mid August and the trend is down. Then, the 10 SMA crosses back up through the 30 EMA in September and the trend is up again - and it stays up for several months thereafter.  

Here are the rules: Focus on long positions only when the 10 SMA is above the 30 EMA. Focus on short positions only when the 10 SMA is below the 30 EMA. It doesn't get any simpler than that and it will ALWAYS keep you on the right side of the trend! Note that moving averages only work well when a stock is trending - not when they are in a trading range. When a stock (or the market itself) becomes "sloppy" then you can ignore moving averages - they won't work! Here are the important things to remember (for long positions - reverse for short positions.):

1. The 10 SMA must be above the 30 EMA.
2. There must be plenty of space in between the moving averages.
3. Both moving averages must be sloping upward.

Wednesday, May 25

Make profit by 3*13*39 Moving Average Method

Most people are comfortable with the herd, market rumours, broker tips, etc. But by confirming your trading decision with the help of this trading system, you will be on the way to more profitable trading.

This simple and robust trading systems will not only identify trends, but will also provide you with entry and exit trading signals.

The Trading System

Remember the numbers 3 x 13 = 39

Simple daily moving averages of 3,13 and 39 can keep you in and out of markets fairly efficiently and profitably, (in any time frame actually). Here's how.

Some basic principles to understand are:

-The market moves in long (secular) trends.
-Intermediate trends can last for months to years.
-Short term trends can last for days to weeks.
-Trade intermediate trends in either direction.
-Trade short term trends only in the direction of the intermediate trend.

Proxies:

3 Day MA - a proxy for price
13 Day MA - a proxy for the short term trend (a moving trend line)
39 Day MA - a proxy for the intermediate trend (a moving trend line).

The Basics of MAs

MAs lag market reversals at tops and bottoms, the larger the MA the longer the lag period, the shorter the MA the shorter the lag but the more frequent the whipsaws. MAs work well when markets trend but get frequently whipsawed when they are in a range.

Therefore, trade trends with the MAs but do not trade ranges using MAs. Just stand aside and be patient until a new trend emerges.

The intermediate trend is in the direction of the 39 MA which acts like a moving trend line. If the 39 MA is pointing up then the intermediate trend is up, if down the trend is down. If the 39 MA is horizontal the market is in a range, from which a trend will, sooner or later, emerge.

Analysis by 3*13*39 Trading Strategy

Simple Trading Rules

1. When the 39 MA is moving up buy when the 3 MA crosses up over the 13 MA. and/or when the 3 MA crosses above the 39 MA.. When the 13 MA crosses above the 39 MA consider adding to your long position. Exit and stand aside when the 3 crosses back below the 13 MA..

2. When the 39 MA is moving down sell short when the 3 MA crosses below the 13 MA. and/or when the 3 MA crosses below the 39 MA.. When the 13 MA crosses below the 39 MA consider adding to your short position. Exit and stand aside when the 3 MA crosses back up over the 13 MA.

3. Only initiate trades in the opposite direction of the intermediate trend when the 3 MA crosses above or below the 39 MA, preferably after the 39 MA has already changed direction.

4. This 3:13 MA crossover will keep you trading in the trend with only a small lag and on the sidelines during corrections. The lag only becomes more substantial at reversals of the intermediate trend (a 3:39 crossover), a small price to pay at these uncertain times of trend transition.

You can set your technical analysis sofware to show bar charts with these 3X13x39 simple MAs. This trading system will help you select the best traders while avoiding the less profitable trades in choppy markets. 

Saturday, May 14

Is ADX the best Technical Indicator?

ADX (Average Directional Movement indicator), most of the peoples are saying that ADX is probably the best indicator. ADX was developed by J. Welles Wilder in order to evaluate the strength of the current trend.
Technical Analysis of Delta Spinning as per ADX
It is an oscillator that fluctuates between 0 and 100. Below 20, it indicates a weak trend and while above 40, it indicates a strong trend.

Another two indicators come with ADX, they are called the Positive Directional Indicator (+DI) and the Negative Directional Indicator (-DI). +DI measures the force of the up moves and –DI measures the force of the down moves.

There is a lot of use for this indicator, some people suggest buying when ADX > 40, others when ADX is rising and DI above -DI.

Thursday, April 21

Profit big using this simple stock trading technique


Technical Analysis of Eastern Cables (Ecables)

Alligator: Bullish
ADX=Rising

A bullish breakout happen, please have a look on following picture:
Bullish Break out of Ecables

Southwind says: TMA, ADX, MACD gives bullish signal but it is in Distribution Zone now. Have a look on following picture:

So, take your decision according to analysis.

Monday, October 18

Lanka-Bangla Finance: a fastest growing financial Institution

LANKA BANGLA FINANCE: A COMPREHENSIVE ANALYSIS
OBJECTIVE:
The purpose of this analytical article is to discuss all aspects of lanka bangla finance including fundamentals, technical aspects, sponsors, future projection and prospect. There is no intension to give a buy or sell signal. Only aim is to give investors possible all informations for safe investment.
Fundamental Information:
Paid-up capital: 531 Million BDT
General shareholder: 271 Million BDT
Lot: 500x10; Available lot for trading: 54200
EPS: 15.62 x2 = 31.2
NAV: 68 (after Q2)
PE: 16.28
HISTORICAL DATA:
DIVIDENT: 2009: 15% cash, 20% B
2008: 15% cash, 15% B
2007: 15% cash, 10% B
EPS: 2009: 17, 2008: 10, 2007: 6 (rounded)
PE at year end: 2009: 22; 2008: 22; 2007: 16
NAV: 2009: 39, 2008: 20; 2007: 15


 SPONSORS:
One bank, STS group, Sampath Bank of Srilanka, Gulf financial and owners of Apollo hospitals Dhaka. STS group and Apollo owners are same……genuine professional businessmen……committed for good transparent governance.
ANALYSIS:

1. In the month of January, its price was 307tk…………….grows positively upto record date of year end declaration to 450……..then price adjustment to 350…………stable for one month……………..again started to growing……………..reaching to 520 and last one month in between 500-530.
2. Average of last 3 years, year end PE ratio is 21, let us conservative and take year end PE as 18. PE before record date was 26.
3. Projected year end EPS would be at least 32.
4. Estimated price at December 31, 2010 = 18 x 32= 576
5. Estimated price at next record date= 22 x 32= 700 (approx.)
6. Share price is now at sideways and in reality slightly downwards, but see Bollinger band is almost squeezing and price surge or hike is just waiting…………..no chance that price will fall below 490
 NEWS DESK:
Lanka Bangla securities, a 99.99% owned subsidiary is waiting for listing……..so far I know indicative price is 250, so IPO price may be 280.
They will offload 30 million share. Present NAV of LBS is 30 tk. Profit in each share 250 tk. Total gain will be 250 x 30 million= 7500 million= 750 crore.
Total capital of LBS will be 55+30 crore=85 crore.
So LBF will be direct gainer of (750x55)/85=485 crore. Net gain just from book building (direct) per share of LBF= 485/5.5=88.
When, lank bangla securities will come in market, its minimum price will be 350. So, 55 crore tk share holding (owned by LBF) of lanka bangla securities will be at market value of 1650 crore. Therefore, gain per share would be 300 tk.
Conclusion, when lanka bangla securities will come in market, LBF per share would be gainer of at least 300+88=388tk.
Inference: With present and historical trend of LBF, it can be assumed its price would around 650tk by mid-february.
After enlistment of Lanka bangla securities, its price could be upto 800-900 depending on overall market scenario. And if market condition is favourable, 1000 will not be a dream…………….I believe it will happen before next June.
(Have nice time, good bye for next 10 days, let me know your views)

Sunday, October 3

Technical Analysis of IFIC Bank


IFIC (International Finance and Investment Corporation) Bank shows very good strength in Dhaka Stock Exchange(DSE). It's previous game has just over in last month of June'10. It was increase to 1147 from 787 within 13 days (T+13), gap= 1147-787=360 taka profit which is 45% only in 13 days in that period.

IFIC bank's second game has just start on 28th September at 1143/-, it is now 1258/- gap=115 /- within 4 working days. Yesterday it has been increased 70/- and today is has been increased 25 taka also. This time it also shows very very strong up-trend. Its up-trend may be continuing for next few weeks and it may cross 1500/- within 13 trading days.

Please see the IFIC bank TA graph:

TA chart of IFIC Bank

In above Candlestick chart, green bar indicate the bullish pattern and red bar indicate the bullish bar.  Arrow indicates the buy or sell signal. Candlestick chart is very popular chart for analysis which was developed in Japan

Tuesday, September 28

Fundamental or technical analysis, which one to choose?

In a high volatile market like DSE/CSE, it is always a difficult job to predict the movement of the market because so many factors are involved which drive this movement. For example, a new strict directive from SEC or any strict circular from Bangladesh Bank can significantly drive the market to a certain direction. There is no mechanism to identify this before it happens. But there are certain things which can predict stock specific behavior. These tools and techniques help avoid unwanted movement of stocks and also help earn good profit from the market. Two types of techniques are widely used to track and predict the behavior stocks. One is fundamental and the other one is technical type of technique. But even we see in DSE/CSE people are using some techniques like wild guess, naive investment or even some random pick. It is true that to start investment in DSE/CSE it is not necessary to learn fundamental or technical analysis as we see most of the people go for "invest in what brokers suggest" and also they are making profit on an average basis. But the question is where an educated investor can earn hefty profit only by knowing some tools and techniques, what is the reason to earn less? Even smart people doubled (may be more than that) their money assuming moderate risk within a year! So it is time to stop avoiding fundamental or technical analysis while investing in DSE/CSE. Now the million dollar question comes "Should I use fundamental or technical analysis?" The straight answer is the best way is to use both in a blended manner. If you are thinking of engaging stock market for a long time, even as your prime business, there is no reason to believe one single technique can offer good return year after year. However it is true that often fundamental themes can be predicted (not with absolute precision) by technical movement of stocks whereas it is not possible to trace technical movement from fundamental analysis. That is why technical analysis is much more popular in DSE/CSE. Nevertheless it is very necessary to understand basic terms of fundamental and technical analysis and also their application before starting such kind of business. These don't need you to be a university graduate or even don't force you to learn English first, you better watch some learning videos or ask any expert who you think is helpful. Hope you understand the message.

Thursday, September 9

How to pickup the Winning Stocks

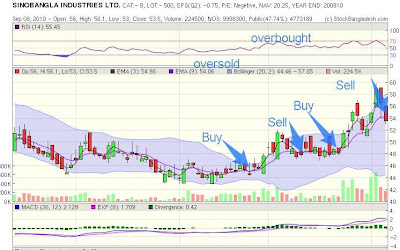
Do you know how to pickup the Winning Stock from the current market? It is very easy from the Technical Analysis (TA) chart. See the following picture:
TA charts of SinoBangla
 It is Technical Analysis charts of SinoBangla. No one can predict it may increase but if you know technical analysis then you can find easily this type stock. You can use overbought and oversold indicators, which shows on the chart. For generating buy/sell signal you should use EMA (Exponential Moving Average). When 3days EMA cross the 9 days EMA then creates buy signal and when 9days EMA cross the 3days EMA then shows the sell signal. you have also look into Volume, MFI (Money Flow index) for more confirmation.

Just using this simple EMA technique we can pickup the Winning Stocks from the current market and make huge money from the stock business.

Wednesday, September 8

Technical Analysis of Banking sector

Present situation of Banking sector

Banking sector current status
Above picture show the current status of banking sector. Relative Strength Index (RSI) is increasing, Volume has spike, Moving Average Convergence-Divergence (MACD) = Cross over. Technical Analysis (TA) chart has given buy signal on Septem 5, 2010. Today all banks pice has increase huge in the bearish market. Out of 30 banks, Jamuna Banks has increase 8.95% due to right approval news, Dutch-Bangla Bank has increase 7.8%, IFIC=7.7%, City Bank=7.25%, Southeast Bank=6.7%, Al-Arafah=5.32%, UCBL=5.25%, First Security Bank=4.74%, Premier Bank=4.7%, Exim Bank=4.29%, Mercentile=4.24%, Brack Bank=4.07%, MTBL=4.04%. Jamuna Bank and Dutch-Bangla Banks are in the Top-Ten gainer list.

SingerBD gives huge profit

As per Technical Analysis SingerBD gave buy signal when it price was 5000 level at the bearish market. SingerBD gave buy signal at 20 July at 5020/-, its RSI was=71.05 (RSI staying above 70 level means uptrend is running very strongly), MFI was=57.56, Accumulation zone, breaks the bollionger upper bands, 3 days EMA crossing 9days EMA. See the TA charts of SingerBD:

TA Analysis of Singer Bangladesh
 We make more then 40% profit from SingerBD by using this technique.

Related Posts Plugin for WordPress, Blogger...

Share

Twitter Delicious Facebook Digg Stumbleupon Favorites More