Showing posts with label Best Indicators. Show all posts

Sunday, June 12

Bollinger Bands


Introduction:

Bollinger Bands are a Technical Trading tool created by John Bollinger in the early 1980s. Bollinger bands are probably one of the most important indicators ever developed for measuring price action volatility. You can use to achieve near perfect entry and exit consistently. There are a few variations on how to use Bollinger bands depending on market conditions.

You can use Bollinger bands as a very accurate indicator within any time frame.

Bollinger Bands Basic:

Bollinger Bands are a way to display volatility and relative overbought and oversold price levels over a specific period. The three parts are commonly labeled as a Center line, Upper band and Lower band. The center line is usually a simple moving average, while the upper and lower bands are simply the centerline with a standard deviation added or subtracted.


The standard settings for the Bollinger Band are a 20-day simple moving average for the center, with a 2 standard deviation set for the outer bands. There is no best setting, but when developed the (20, 2) setting were used by John Bollinger, and will work for most stock charts.

How to trade with Bollinger band

The candlesticks present represent current approaching price action to the upper band or lower band. Lets start with number 1 to number 8, one by one.

1. Extremely bearish, price is falling to a lower band and the KEY is of course watching both the upper and lower band as price approaches. In this case the upper is rising while the lower is falling indicating not only a potential explosion in price but one to the downside is extremely likely.
2. Extremely bullish, price is rising to the upper band and the KEY is keeping a watchful eye on BOTH band as price approaches. In this case the upper band heads UP and the lower band falls, indicating a potential price explosion to the upside.
3. Price approaches the lower band while the upper and lower band remain flat. This is very insignificant and should be ignored unless things change.
4. Price approaches the upper band while the upper and lower bands remain flat. This is also insignificant and best left for the amateurs to enter.
5. Bearish candlestick at a lower band while band constrict - this is a sign that price is likely at least for now going nowhere. Wait do not enter.
6. Same here, a bullish candlestick at the upper band while the bands are constricting is a sign that not much is about to happen just yet.
7. Like number 1 this is a sign that price is going to make a nice move but the lack of the upper band hooking up indicates that the move for now won't necessarily be explosive.
8. Also similar to its counterpart in that price will likely move but not to the explosive level that would be expedited if the lower band was hooking downward.  The lack of the lower band hooking down limits the potential move here.

Conclusions

Bollinger Bands reflect direction with the 20-period SMA and volatility with the upper/lower bands. As such, they can be used to determine if prices are relatively high or low. According to Bollinger, the bands should contain 85-90% of price action, which makes a move outside the bands significant. Technically, prices are relatively high when above the upper band and relatively low when below the lower band. However, relatively high should not be regarded as bearish or as a sell signal. Likewise, relatively low should not be considered bullish or as a buy signal. Prices are high or low for a reason. As with other indicators, Bollinger Bands are not meant to be used as a stand alone tool. Chartists should combine Bollinger Bands with basic trend analysis and other indicators for confirmation. So, Bollinger bands is a very accurate indicator within any time frame.

Tuesday, June 7

Make profit by using Moving Averages

A moving average line is just the average price of a stock over the period of time. The Two Moving Averages Use two moving averages: the 10-SMA and the 30-EMA. I like to use a slower one and a faster one. Do you know Why? Because when the faster one (10) crosses over the slower one (30), it will often signal a trend change. Let's look at an example: Delta Spinning chart of moving averages:

Chart of Delta Spinning


You can see in the chart above how these lines can help you define trends. On the left side of the chart the 10 SMA is above the 30 EMA and the trend is up. The 10 SMA crosses down below the 30 EMA in mid August and the trend is down. Then, the 10 SMA crosses back up through the 30 EMA in September and the trend is up again - and it stays up for several months thereafter.  

Here are the rules: Focus on long positions only when the 10 SMA is above the 30 EMA. Focus on short positions only when the 10 SMA is below the 30 EMA. It doesn't get any simpler than that and it will ALWAYS keep you on the right side of the trend! Note that moving averages only work well when a stock is trending - not when they are in a trading range. When a stock (or the market itself) becomes "sloppy" then you can ignore moving averages - they won't work! Here are the important things to remember (for long positions - reverse for short positions.):

1. The 10 SMA must be above the 30 EMA.
2. There must be plenty of space in between the moving averages.
3. Both moving averages must be sloping upward.

Wednesday, May 25

Make profit by 3*13*39 Moving Average Method

Most people are comfortable with the herd, market rumours, broker tips, etc. But by confirming your trading decision with the help of this trading system, you will be on the way to more profitable trading.

This simple and robust trading systems will not only identify trends, but will also provide you with entry and exit trading signals.

The Trading System

Remember the numbers 3 x 13 = 39

Simple daily moving averages of 3,13 and 39 can keep you in and out of markets fairly efficiently and profitably, (in any time frame actually). Here's how.

Some basic principles to understand are:

-The market moves in long (secular) trends.
-Intermediate trends can last for months to years.
-Short term trends can last for days to weeks.
-Trade intermediate trends in either direction.
-Trade short term trends only in the direction of the intermediate trend.

Proxies:

3 Day MA - a proxy for price
13 Day MA - a proxy for the short term trend (a moving trend line)
39 Day MA - a proxy for the intermediate trend (a moving trend line).

The Basics of MAs

MAs lag market reversals at tops and bottoms, the larger the MA the longer the lag period, the shorter the MA the shorter the lag but the more frequent the whipsaws. MAs work well when markets trend but get frequently whipsawed when they are in a range.

Therefore, trade trends with the MAs but do not trade ranges using MAs. Just stand aside and be patient until a new trend emerges.

The intermediate trend is in the direction of the 39 MA which acts like a moving trend line. If the 39 MA is pointing up then the intermediate trend is up, if down the trend is down. If the 39 MA is horizontal the market is in a range, from which a trend will, sooner or later, emerge.

Analysis by 3*13*39 Trading Strategy

Simple Trading Rules

1. When the 39 MA is moving up buy when the 3 MA crosses up over the 13 MA. and/or when the 3 MA crosses above the 39 MA.. When the 13 MA crosses above the 39 MA consider adding to your long position. Exit and stand aside when the 3 crosses back below the 13 MA..

2. When the 39 MA is moving down sell short when the 3 MA crosses below the 13 MA. and/or when the 3 MA crosses below the 39 MA.. When the 13 MA crosses below the 39 MA consider adding to your short position. Exit and stand aside when the 3 MA crosses back up over the 13 MA.

3. Only initiate trades in the opposite direction of the intermediate trend when the 3 MA crosses above or below the 39 MA, preferably after the 39 MA has already changed direction.

4. This 3:13 MA crossover will keep you trading in the trend with only a small lag and on the sidelines during corrections. The lag only becomes more substantial at reversals of the intermediate trend (a 3:39 crossover), a small price to pay at these uncertain times of trend transition.

You can set your technical analysis sofware to show bar charts with these 3X13x39 simple MAs. This trading system will help you select the best traders while avoiding the less profitable trades in choppy markets. 

Saturday, May 14

Is ADX the best Technical Indicator?

ADX (Average Directional Movement indicator), most of the peoples are saying that ADX is probably the best indicator. ADX was developed by J. Welles Wilder in order to evaluate the strength of the current trend.
Technical Analysis of Delta Spinning as per ADX
It is an oscillator that fluctuates between 0 and 100. Below 20, it indicates a weak trend and while above 40, it indicates a strong trend.

Another two indicators come with ADX, they are called the Positive Directional Indicator (+DI) and the Negative Directional Indicator (-DI). +DI measures the force of the up moves and –DI measures the force of the down moves.

There is a lot of use for this indicator, some people suggest buying when ADX > 40, others when ADX is rising and DI above -DI.

Tuesday, April 19

Awesome Oscillator Technical Indicator (AO)

Awesome Oscillator Technical Indicator (AO) is a 34-period simple moving average, plotted through the middle points of the bars (H+L)/2, which is subtracted from the 5-period simple moving average, built across the central points of the bars (H+L)/2. It shows us quite clearly what’s happening to the market driving force at the present moment.
Awesome Indicator
This indicator plots the oscillator as a histogram where blue denotes periods suited for buying and red . for selling. If the current value of AO (Awesome Oscillator) is above previous, the period is considered suited for buying and the period is marked blue. If the AO value is not above previous, the period is considered suited for selling and the indicator marks it as red. 

Caution: Don't follow only one indicator, use other indicators to confirm buy-sale signals

AFL: Awesome Indicator afl (to download afl click here)
(download this afl file, unzip and paste it in custom folder under Formals in AmiBroker)

Thursday, September 9

How to pickup the Winning Stocks

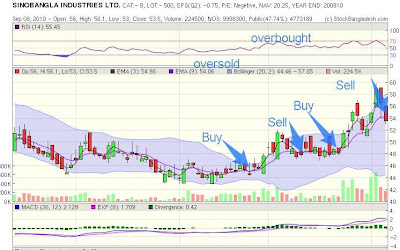
Do you know how to pickup the Winning Stock from the current market? It is very easy from the Technical Analysis (TA) chart. See the following picture:
TA charts of SinoBangla
 It is Technical Analysis charts of SinoBangla. No one can predict it may increase but if you know technical analysis then you can find easily this type stock. You can use overbought and oversold indicators, which shows on the chart. For generating buy/sell signal you should use EMA (Exponential Moving Average). When 3days EMA cross the 9 days EMA then creates buy signal and when 9days EMA cross the 3days EMA then shows the sell signal. you have also look into Volume, MFI (Money Flow index) for more confirmation.

Just using this simple EMA technique we can pickup the Winning Stocks from the current market and make huge money from the stock business.

Related Posts Plugin for WordPress, Blogger...

Share

Twitter Delicious Facebook Digg Stumbleupon Favorites More